Notes#
Show imports
import os

import dimcat as dc
import ms3
import pandas as pd
import plotly.express as px
from dimcat import filters, plotting

import utils

pd.set_option("display.max_rows", 1000)
pd.set_option("display.max_columns", 500)
/usr/lib/python3/dist-packages/requests/__init__.py:106: RequestsDependencyWarning: urllib3 (2.0.7) or chardet (6.0.0.post1)/charset_normalizer (None) doesn't match a supported version!
  warnings.warn(
Show source
RESULTS_PATH = os.path.abspath(os.path.join(utils.OUTPUT_FOLDER, "notes_stats"))
os.makedirs(RESULTS_PATH, exist_ok=True)


def make_output_path(
    filename: str,
    extension=None,
    path=RESULTS_PATH,
) -> str:
    return utils.make_output_path(filename=filename, extension=extension, path=path)


def save_figure_as(
    fig, filename, formats=("png", "pdf"), directory=RESULTS_PATH, **kwargs
):
    if formats is not None:
        for fmt in formats:
            plotting.write_image(fig, filename, directory, format=fmt, **kwargs)
    else:
        plotting.write_image(fig, filename, directory, **kwargs)
Loading data
Show source
D = utils.get_dataset("beethoven_piano_sonatas", corpus_release="v2.5")
package = D.inputs.get_package()
package_info = package._package.custom
git_tag = package_info.get("git_tag")
utils.print_heading("Data and software versions")
print("Ludwig van Beethoven – Piano Sonatas version v2.5")
print(f"Datapackage '{package.package_name}' @ {git_tag}")
print(f"dimcat version {dc.__version__}\n")
D
Data and software versions
--------------------------

Ludwig van Beethoven – Piano Sonatas version v2.5
Datapackage 'beethoven_piano_sonatas' @ v2.5
dimcat version 3.4.1
Dataset
=======
{'inputs': {'basepath': None,
            'packages': {'beethoven_piano_sonatas': ["'beethoven_piano_sonatas.measures' "
                                                     '(MuseScoreFacetName.MuseScoreMeasures)',
                                                     "'beethoven_piano_sonatas.notes' "
                                                     '(MuseScoreFacetName.MuseScoreNotes)',
                                                     "'beethoven_piano_sonatas.expanded' "
                                                     '(MuseScoreFacetName.MuseScoreHarmonies)',
                                                     "'beethoven_piano_sonatas.chords' "
                                                     '(MuseScoreFacetName.MuseScoreChords)',
                                                     "'beethoven_piano_sonatas.metadata' (FeatureName.Metadata)"]}},
 'outputs': {'basepath': None, 'packages': {}},
 'pipeline': []}
Metadata#
filtered_D = filters.HasHarmonyLabelsFilter(keep_values=[True]).process(D)

all_metadata = filtered_D.get_metadata()
all_metadata.reset_index(level=1).groupby(level=0).nth(0).iloc[:, :20]
| piece | TimeSig | KeySig | last_mc | last_mn | length_qb | last_mc_unfolded | last_mn_unfolded | length_qb_unfolded | volta_mcs | all_notes_qb | n_onsets | n_onset_positions | guitar_chord_count | form_label_count | label_count | annotated_key | harmony_version | annotators | reviewers | |
|---|---|---|---|---|---|---|---|---|---|---|---|---|---|---|---|---|---|---|---|---|
| corpus | ||||||||||||||||||||
| beethoven_piano_sonatas | 01-1 | {1: '2/2'} | {1: -4} | 154 | 152 | 608.0 | 308 | 304 | 1216.0 | () | 1476.0 | 1679 | 985 | 0 | 0 | 241 | f | 2.3.0 | Lars & Ya-Chuan (2.2.0), John Heilig (2.3.0) | AN |
chronological_order = utils.chronological_corpus_order(all_metadata)
corpus_colors = dict(zip(chronological_order, utils.CORPUS_COLOR_SCALE))
notes_feature = filtered_D.get_feature("notes")
all_notes = notes_feature.df
print(f"{len(all_notes.index)} notes over {len(all_notes.groupby(level=[0,1]))} files.")
all_notes.head()
167022 notes over 64 files.
| mc | mn | quarterbeats | quarterbeats_all_endings | duration_qb | duration | mc_onset | mn_onset | timesig | staff | voice | volta | chord_id | gracenote | midi | name | nominal_duration | octave | scalar | tied | tremolo | tpc_name | tpc | |||
|---|---|---|---|---|---|---|---|---|---|---|---|---|---|---|---|---|---|---|---|---|---|---|---|---|---|
| corpus | piece | i | |||||||||||||||||||||||
| beethoven_piano_sonatas | 01-1 | 0 | 1 | 0 | 0 | 0 | 1.0 | 1/4 | 0 | 3/4 | 2/2 | 1 | 1 | <NA> | 0 | <NA> | 60 | C4 | 1/4 | 4 | 1 | <NA> | <NA> | C | 0 |
| 1 | 2 | 1 | 1 | 1 | 1.0 | 1/4 | 0 | 0 | 2/2 | 1 | 1 | <NA> | 1 | <NA> | 65 | F4 | 1/4 | 4 | 1 | <NA> | <NA> | F | -1 | ||
| 2 | 2 | 1 | 2 | 2 | 1.0 | 1/4 | 1/4 | 1/4 | 2/2 | 1 | 1 | <NA> | 2 | <NA> | 68 | Ab4 | 1/4 | 4 | 1 | <NA> | <NA> | Ab | -4 | ||
| 3 | 2 | 1 | 3 | 3 | 1.0 | 1/4 | 1/2 | 1/2 | 2/2 | 1 | 1 | <NA> | 3 | <NA> | 72 | C5 | 1/4 | 5 | 1 | <NA> | <NA> | C | 0 | ||
| 4 | 2 | 1 | 4 | 4 | 1.0 | 1/4 | 3/4 | 3/4 | 2/2 | 1 | 1 | <NA> | 4 | <NA> | 77 | F5 | 1/4 | 5 | 1 | <NA> | <NA> | F | -1 |
def weight_notes(nl, group_col="midi", precise=True):
    summed_durations = nl.groupby(group_col).duration_qb.sum()
    shortest_duration = summed_durations[summed_durations > 0].min()
    summed_durations /= shortest_duration  # normalize such that the shortest duration results in 1 occurrence
    if not precise:
        # This simple trick reduces compute time but also precision:
        # The rationale is to have the smallest value be slightly larger than 0.5 because
        # if it was exactly 0.5 it would be rounded down by repeat_notes_according_to_weights()
        summed_durations /= 1.9999999
    return repeat_notes_according_to_weights(summed_durations)


def repeat_notes_according_to_weights(weights):
    try:
        counts = weights.round().astype(int)
    except Exception:
        return pd.Series(dtype=int)
    counts_reflecting_weights = []
    for pitch, count in counts.items():
        counts_reflecting_weights.extend([pitch] * count)
    return pd.Series(counts_reflecting_weights)
Ambitus#
corpus_names = {
    corp: utils.get_corpus_display_name(corp) for corp in chronological_order
}
chronological_corpus_names = list(corpus_names.values())
corpus_name_colors = {
    corpus_names[corp]: color for corp, color in corpus_colors.items()
}
all_notes["corpus_name"] = all_notes.index.get_level_values(0).map(corpus_names)
grouped_notes = all_notes.groupby("corpus_name")
weighted_midi = pd.concat(
    [weight_notes(nl, "midi", precise=False) for _, nl in grouped_notes],
    keys=grouped_notes.groups.keys(),
).reset_index(level=0)
weighted_midi.columns = ["dataset", "midi"]
weighted_midi
| dataset | midi | |
|---|---|---|
| 0 | Beethoven Sonatas | 24 |
| 1 | Beethoven Sonatas | 24 |
| 2 | Beethoven Sonatas | 24 |
| 3 | Beethoven Sonatas | 24 |
| 4 | Beethoven Sonatas | 24 |
| ... | ... | ... |
| 299396 | Beethoven Sonatas | 98 |
| 299397 | Beethoven Sonatas | 99 |
| 299398 | Beethoven Sonatas | 99 |
| 299399 | Beethoven Sonatas | 99 |
| 299400 | Beethoven Sonatas | 101 |
299401 rows × 2 columns
# fig = px.violin(weighted_midi,
#                 x='dataset',
#                 y='midi',
#                 color='dataset',
#                 title="Corpus-wise distribution over registers (ambitus)",
#                 box=True,
#                 labels=dict(
#                     dataset='',
#                     midi='distribution of pitches by duration'
#                 ),
#                 category_orders=dict(dataset=chronological_corpus_names),
#                 color_discrete_map=corpus_name_colors,
#                 width=1000, height=600,
#                )
# fig.update_traces(spanmode='hard') # do not extend beyond outliers
# fig.update_layout(**utils.STD_LAYOUT,
#                  showlegend=False)
# fig.update_yaxes(
#     tickmode= 'array',
#     tickvals= [12, 24, 36, 48, 60, 72, 84, 96],
#     ticktext = ["C0", "C1", "C2", "C3", "C4", "C5", "C6", "C7"],
# )
# fig.update_xaxes(tickangle=45)
# save_figure_as(fig, "ambitus_corpuswise_violins")
# fig.show()
Tonal Pitch Classes (TPC)#
weighted_tpc = pd.concat(
    [weight_notes(nl, "tpc") for _, nl in grouped_notes],
    keys=grouped_notes.groups.keys(),
).reset_index(level=0)
weighted_tpc.columns = ["dataset", "tpc"]
weighted_tpc
| dataset | tpc | |
|---|---|---|
| 0 | Beethoven Sonatas | -10 |
| 1 | Beethoven Sonatas | -9 |
| 2 | Beethoven Sonatas | -9 |
| 3 | Beethoven Sonatas | -9 |
| 4 | Beethoven Sonatas | -9 |
| ... | ... | ... |
| 49897 | Beethoven Sonatas | 15 |
| 49898 | Beethoven Sonatas | 15 |
| 49899 | Beethoven Sonatas | 15 |
| 49900 | Beethoven Sonatas | 15 |
| 49901 | Beethoven Sonatas | 16 |
49902 rows × 2 columns
As violin plot#
# fig = px.violin(weighted_tpc,
#                 x='dataset',
#                 y='tpc',
#                 color='dataset',
#                 title="Corpus-wise distribution over line of fifths (tonal pitch classes)",
#                 box=True,
#                 labels=dict(
#                     dataset='',
#                     tpc='distribution of tonal pitch classes by duration'
#                 ),
#                 category_orders=dict(dataset=chronological_corpus_names),
#                 color_discrete_map=corpus_name_colors,
#                 width=1000,
#                 height=600,
#                )
# fig.update_traces(spanmode='hard') # do not extend beyond outliers
# fig.update_layout(**utils.STD_LAYOUT,
#                  showlegend=False)
# fig.update_yaxes(
#     tickmode= 'array',
#     tickvals= [-12, -9, -6, -3, 0, 3, 6, 9, 12, 15, 18],
#     ticktext = ["Dbb", "Bbb", "Gb", "Eb", "C", "A", "F#", "D#", "B#", "G##", "E##"],
#     zerolinecolor='grey',
#     zeroline=True
# )
# fig.update_xaxes(tickangle=45)
# save_figure_as(fig, "pitch_class_distributions_corpuswise_violins")
# fig.show()
(all_notes)
| mc | mn | quarterbeats | quarterbeats_all_endings | duration_qb | duration | mc_onset | mn_onset | timesig | staff | voice | volta | chord_id | gracenote | midi | name | nominal_duration | octave | scalar | tied | tremolo | tpc_name | tpc | corpus_name | |||
|---|---|---|---|---|---|---|---|---|---|---|---|---|---|---|---|---|---|---|---|---|---|---|---|---|---|---|
| corpus | piece | i | ||||||||||||||||||||||||
| beethoven_piano_sonatas | 01-1 | 0 | 1 | 0 | 0 | 0 | 1.0 | 1/4 | 0 | 3/4 | 2/2 | 1 | 1 | <NA> | 0 | <NA> | 60 | C4 | 1/4 | 4 | 1 | <NA> | <NA> | C | 0 | Beethoven Sonatas |
| 1 | 2 | 1 | 1 | 1 | 1.0 | 1/4 | 0 | 0 | 2/2 | 1 | 1 | <NA> | 1 | <NA> | 65 | F4 | 1/4 | 4 | 1 | <NA> | <NA> | F | -1 | Beethoven Sonatas | ||
| 2 | 2 | 1 | 2 | 2 | 1.0 | 1/4 | 1/4 | 1/4 | 2/2 | 1 | 1 | <NA> | 2 | <NA> | 68 | Ab4 | 1/4 | 4 | 1 | <NA> | <NA> | Ab | -4 | Beethoven Sonatas | ||
| 3 | 2 | 1 | 3 | 3 | 1.0 | 1/4 | 1/2 | 1/2 | 2/2 | 1 | 1 | <NA> | 3 | <NA> | 72 | C5 | 1/4 | 5 | 1 | <NA> | <NA> | C | 0 | Beethoven Sonatas | ||
| 4 | 2 | 1 | 4 | 4 | 1.0 | 1/4 | 3/4 | 3/4 | 2/2 | 1 | 1 | <NA> | 4 | <NA> | 77 | F5 | 1/4 | 5 | 1 | <NA> | <NA> | F | -1 | Beethoven Sonatas | ||
| ... | ... | ... | ... | ... | ... | ... | ... | ... | ... | ... | ... | ... | ... | ... | ... | ... | ... | ... | ... | ... | ... | ... | ... | ... | ... | |
| 32-2 | 6215 | 191 | 177 | 1495/4 | 1551/4 | 0.5 | 1/8 | 3/16 | 3/16 | 9/16 | 2 | 1 | <NA> | 5191 | <NA> | 36 | C2 | 1/8 | 2 | 1 | <NA> | <NA> | C | 0 | Beethoven Sonatas | |
| 6216 | 191 | 177 | 1495/4 | 1551/4 | 0.5 | 1/8 | 3/16 | 3/16 | 9/16 | 2 | 1 | <NA> | 5191 | <NA> | 48 | C3 | 1/8 | 3 | 1 | <NA> | <NA> | C | 0 | Beethoven Sonatas | ||
| 6217 | 191 | 177 | 1495/4 | 1551/4 | 0.5 | 1/8 | 3/16 | 3/16 | 9/16 | 1 | 1 | <NA> | 5188 | <NA> | 52 | E3 | 1/8 | 3 | 1 | <NA> | <NA> | E | 4 | Beethoven Sonatas | ||
| 6218 | 191 | 177 | 1495/4 | 1551/4 | 0.5 | 1/8 | 3/16 | 3/16 | 9/16 | 1 | 1 | <NA> | 5188 | <NA> | 55 | G3 | 1/8 | 3 | 1 | <NA> | <NA> | G | 1 | Beethoven Sonatas | ||
| 6219 | 191 | 177 | 1495/4 | 1551/4 | 0.5 | 1/8 | 3/16 | 3/16 | 9/16 | 1 | 1 | <NA> | 5188 | <NA> | 60 | C4 | 1/8 | 4 | 1 | <NA> | <NA> | C | 0 | Beethoven Sonatas |
167022 rows × 24 columns
width = 1400
height = 800

weighted_pitch_values = pd.concat(
    [
        weighted_midi.rename(columns={"midi": "value"}),
        weighted_tpc.rename(columns={"tpc": "value"}),
    ],
    keys=["MIDI pitch", "Tonal pitch class"],
    names=["distribution"],
).reset_index(level=[0, 1])

fig = plotting.make_violin_plot(
    weighted_pitch_values,
    x_col="dataset",
    y_col="value",
    color="dataset",
    facet_row="distribution",
    box=True,
    labels=dict(dataset="", tpc="distribution of tonal pitch classes by duration"),
    category_orders=dict(dataset=chronological_corpus_names),
    # color_discrete_map=corpus_name_colors,
    color_discrete_sequence=px.colors.qualitative.Dark24,
    traces_settings=dict(
        spanmode="hard",
        width=1,
        # scalemode='width'
    ),
    layout=dict(
        showlegend=False,
        margin=dict(
            t=0,
            b=0,
            l=0,
            r=0,
        ),
    ),
    x_axis=dict(
        # tickangle=45,
        tickfont_size=15
    ),
    y_axis=dict(
        tickmode="array",
        tickvals=[-12, -9, -6, -3, 0, 3, 6, 9, 12, 15, 24, 36, 48, 60, 72, 84, 96],
        ticktext=[
            "Dbb",
            "Bbb",
            "Gb",
            "Eb",
            "C",
            "A",
            "F#",
            "D#",
            "B#",
            "G##",
            "C1",
            "C2",
            "C3",
            "C4",
            "C5",
            "C6",
            "C7",
        ],
        zerolinecolor="grey",
        zeroline=True,
    ),
    width=width,
    height=height,
)
utils.realign_subplot_axes(fig, y_axes=dict(title_text=""))
save_figure_as(fig, "notes_violin", width=width, height=height)
# Render as a static image: the interactive violin embeds every note's value
# inline, producing a >100 MB HTML for the metacorpus (exceeds GitHub's file
# size limit and is unusable in a browser). The rasterised PNG is a few KB.
fig.show(renderer="png")
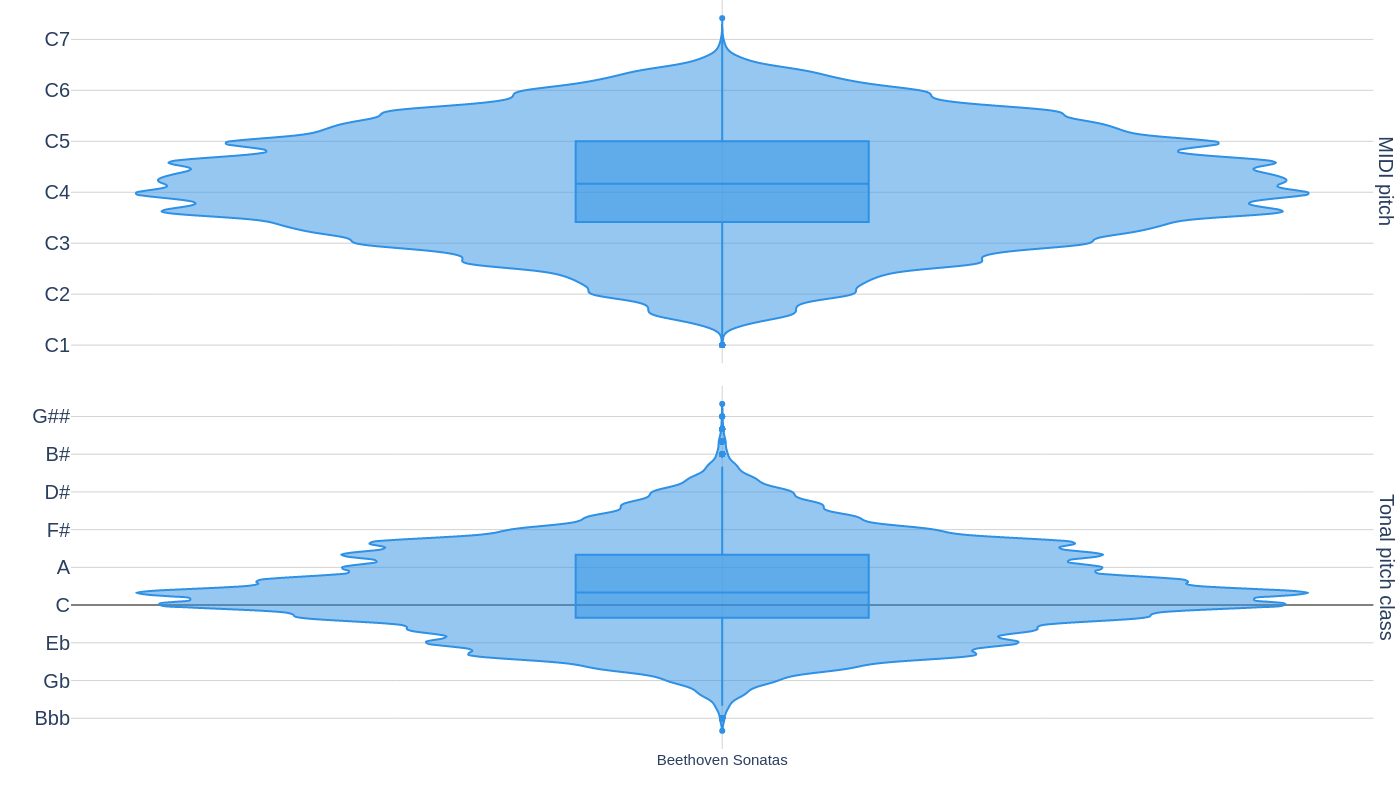
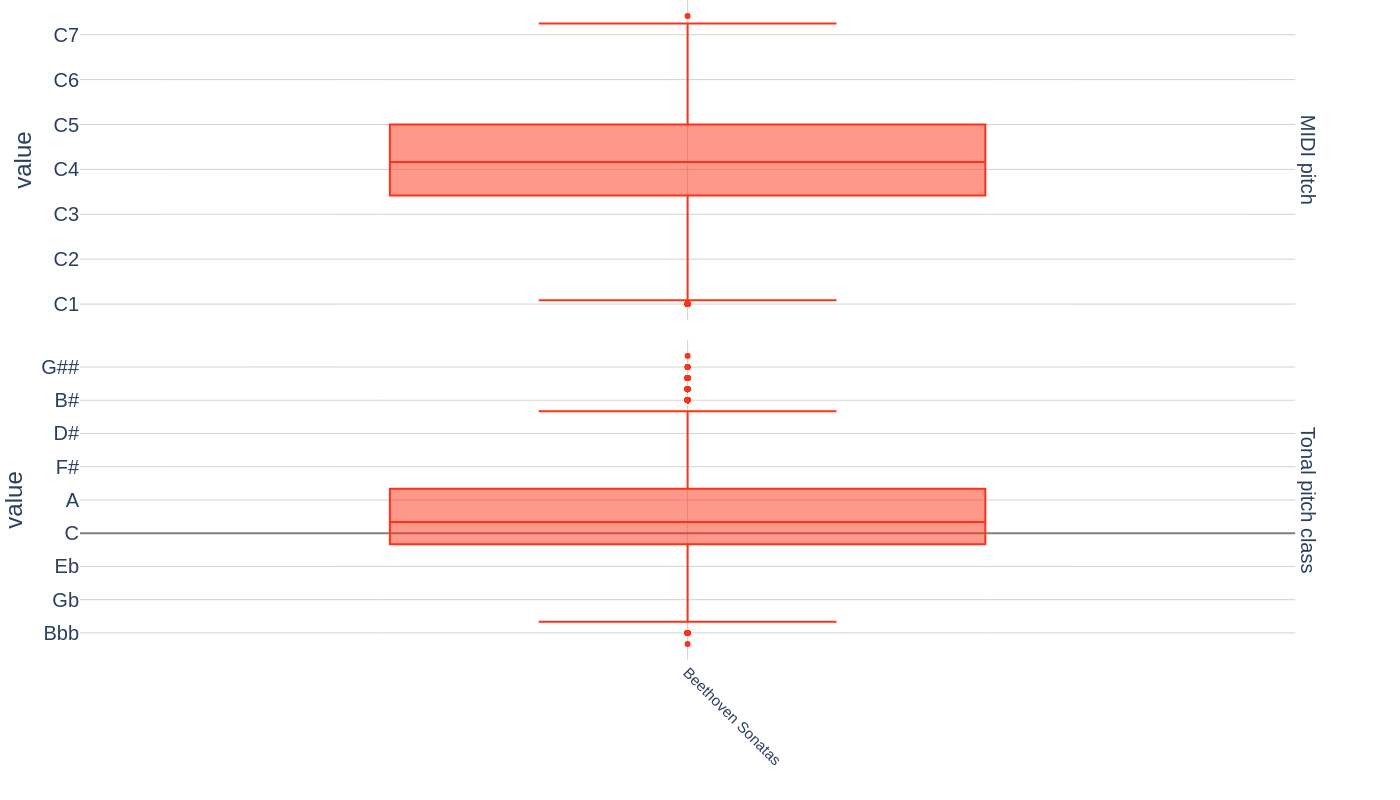
fig = plotting.make_box_plot(
    weighted_pitch_values,
    x_col="dataset",
    y_col="value",
    color="dataset",
    facet_row="distribution",
    # box=True,
    labels=dict(dataset="", tpc="distribution of tonal pitch classes by duration"),
    category_orders=dict(dataset=chronological_corpus_names),
    # color_discrete_map=corpus_name_colors,
    color_discrete_sequence=px.colors.qualitative.Light24,
    # traces_settings=dict(spanmode='hard'),
    layout=dict(showlegend=False, margin=dict(t=0)),
    x_axis=dict(tickangle=45, tickfont_size=15),
    y_axis=dict(
        tickmode="array",
        tickvals=[-12, -9, -6, -3, 0, 3, 6, 9, 12, 15, 24, 36, 48, 60, 72, 84, 96],
        ticktext=[
            "Dbb",
            "Bbb",
            "Gb",
            "Eb",
            "C",
            "A",
            "F#",
            "D#",
            "B#",
            "G##",
            "C1",
            "C2",
            "C3",
            "C4",
            "C5",
            "C6",
            "C7",
        ],
        zerolinecolor="grey",
        zeroline=True,
    ),
    width=width,
    height=height,
)
utils.realign_subplot_axes(fig, y_axes=True)
save_figure_as(fig, "notes_box", width=width, height=height)
# Render as a static image (see notes_violin above): avoids a >100 MB HTML.
fig.show(renderer="png")
As bar plots#
bar_data = all_notes.groupby("tpc").duration_qb.sum().reset_index()
x_values = list(range(bar_data.tpc.min(), bar_data.tpc.max() + 1))
x_names = ms3.fifths2name(x_values)
fig = px.bar(
    bar_data,
    x="tpc",
    y="duration_qb",
    labels=dict(tpc="Named pitch class", duration_qb="Duration in quarter notes"),
    color_discrete_sequence=utils.CORPUS_COLOR_SCALE,
    width=1000,
    height=300,
)
fig.update_layout(**utils.STD_LAYOUT)
fig.update_xaxes(
    zerolinecolor="grey",
    tickmode="array",
    tickvals=x_values,
    ticktext=x_names,
    dtick=1,
    ticks="outside",
    tickcolor="black",
    minor=dict(dtick=6, gridcolor="grey", showgrid=True),
)
save_figure_as(fig, "pitch_class_distribution_absolute_bars")
fig.show()
scatter_data = all_notes.groupby(["corpus_name", "tpc"]).duration_qb.sum().reset_index()
fig = px.bar(
    scatter_data,
    x="tpc",
    y="duration_qb",
    color="corpus_name",
    labels=dict(
        duration_qb="duration",
        tpc="named pitch class",
    ),
    category_orders=dict(dataset=chronological_corpus_names),
    color_discrete_map=corpus_name_colors,
    width=1000,
    height=500,
)
fig.update_layout(**utils.STD_LAYOUT)
fig.update_xaxes(
    zerolinecolor="grey",
    tickmode="array",
    tickvals=x_values,
    ticktext=x_names,
    dtick=1,
    ticks="outside",
    tickcolor="black",
    minor=dict(dtick=6, gridcolor="grey", showgrid=True),
)
save_figure_as(fig, "pitch_class_distribution_corpuswise_absolute_bars")
fig.show()
As scatter plots#
fig = px.scatter(
    scatter_data,
    x="tpc",
    y="duration_qb",
    color="corpus_name",
    labels=dict(
        duration_qb="duration",
        tpc="named pitch class",
    ),
    category_orders=dict(dataset=chronological_corpus_names),
    color_discrete_map=corpus_name_colors,
    facet_col="corpus_name",
    facet_col_wrap=3,
    facet_col_spacing=0.03,
    width=1000,
    height=1000,
)
fig.update_traces(mode="lines+markers")
fig.for_each_annotation(lambda a: a.update(text=a.text.split("=")[-1]))
fig.update_layout(**utils.STD_LAYOUT, showlegend=False)
fig.update_xaxes(
    zerolinecolor="grey",
    tickmode="array",
    tickvals=[-12, -6, 0, 6, 12, 18],
    ticktext=["Dbb", "Gb", "C", "F#", "B#", "E##"],
    visible=True,
)
fig.update_yaxes(zeroline=False, matches=None, showticklabels=True)
save_figure_as(fig, "pitch_class_distribution_corpuswise_scatter")
fig.show()
no_accidental = bar_data[bar_data.tpc.between(-1, 5)].duration_qb.sum()
with_accidental = bar_data[~bar_data.tpc.between(-1, 5)].duration_qb.sum()
entire = no_accidental + with_accidental
(
    f"Fraction of note duration without accidental of the entire durations: {no_accidental} / {entire} = "
    f"{no_accidental / entire}"
)
'Fraction of note duration without accidental of the entire durations: 65656.82136544012 / 99798.84166666667 = 0.6578916174672379'
Notes and staves#
print("Distribution of notes over staves:")
utils.value_count_df(all_notes.staff)
Distribution of notes over staves:
| counts | % | |
|---|---|---|
| staff | ||
| 1 | 86729 | 51.93 |
| 2 | 80293 | 48.07 |